Data Analyst | SQL | Power BI
Project Control & Execution Monitoring Dashboard
Power BI · Data Modeling · DAX · Business Intelligence
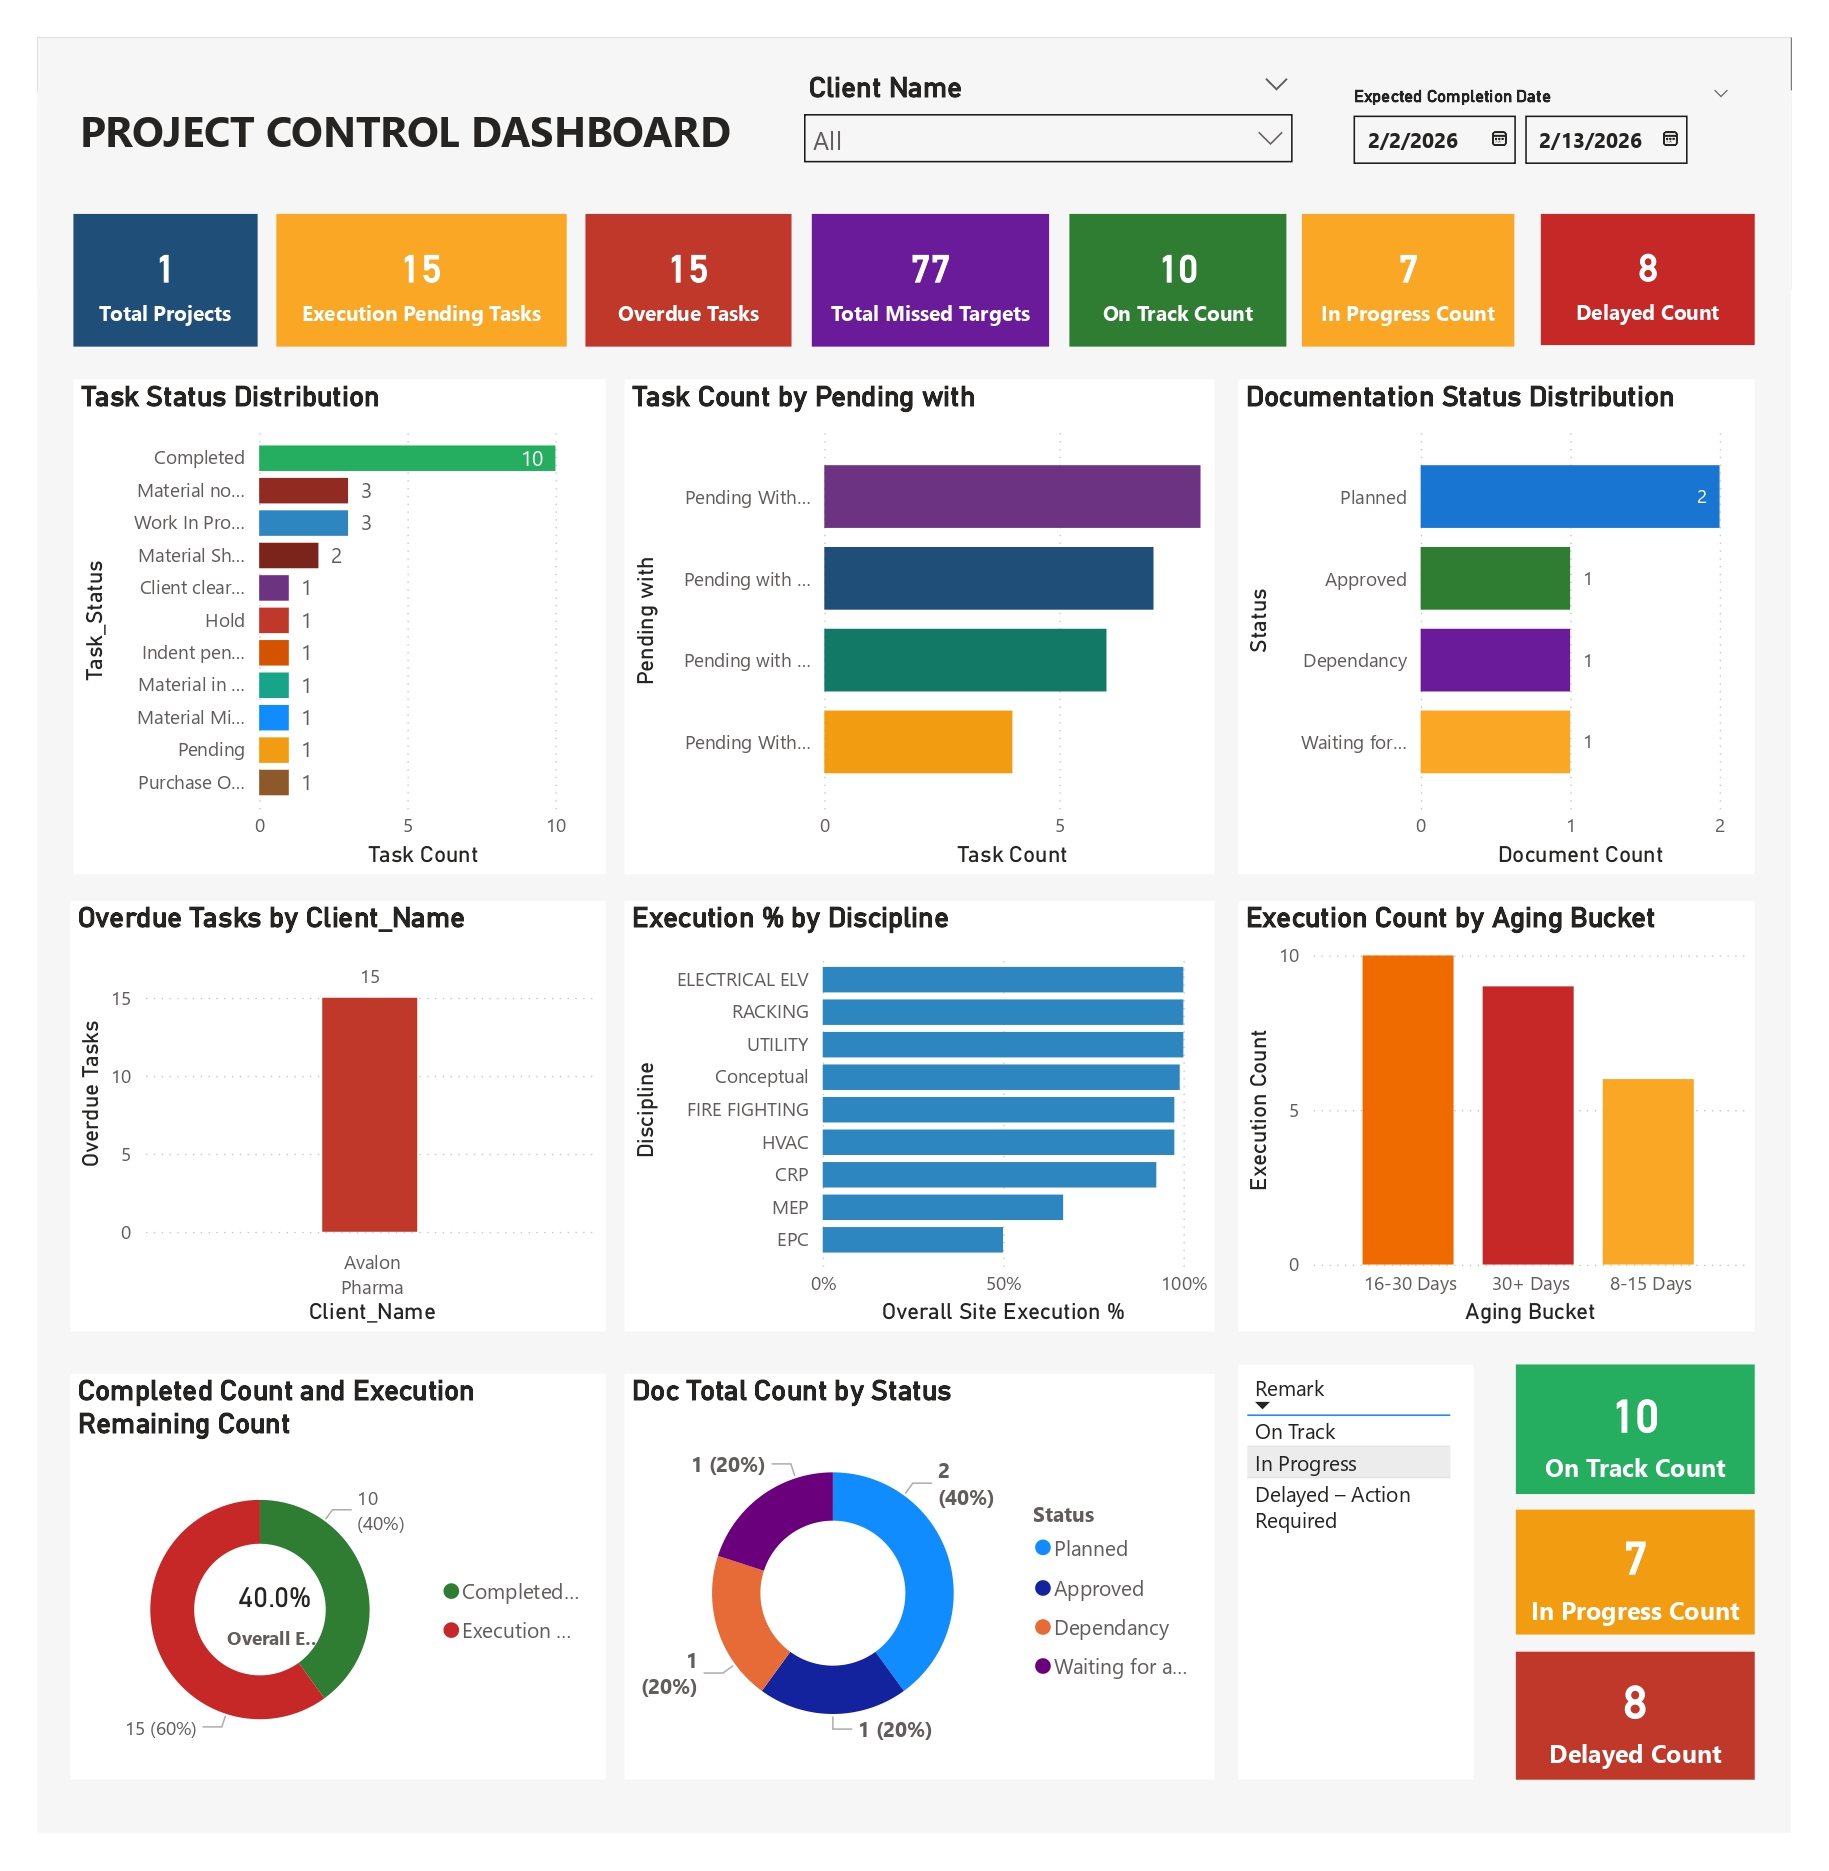
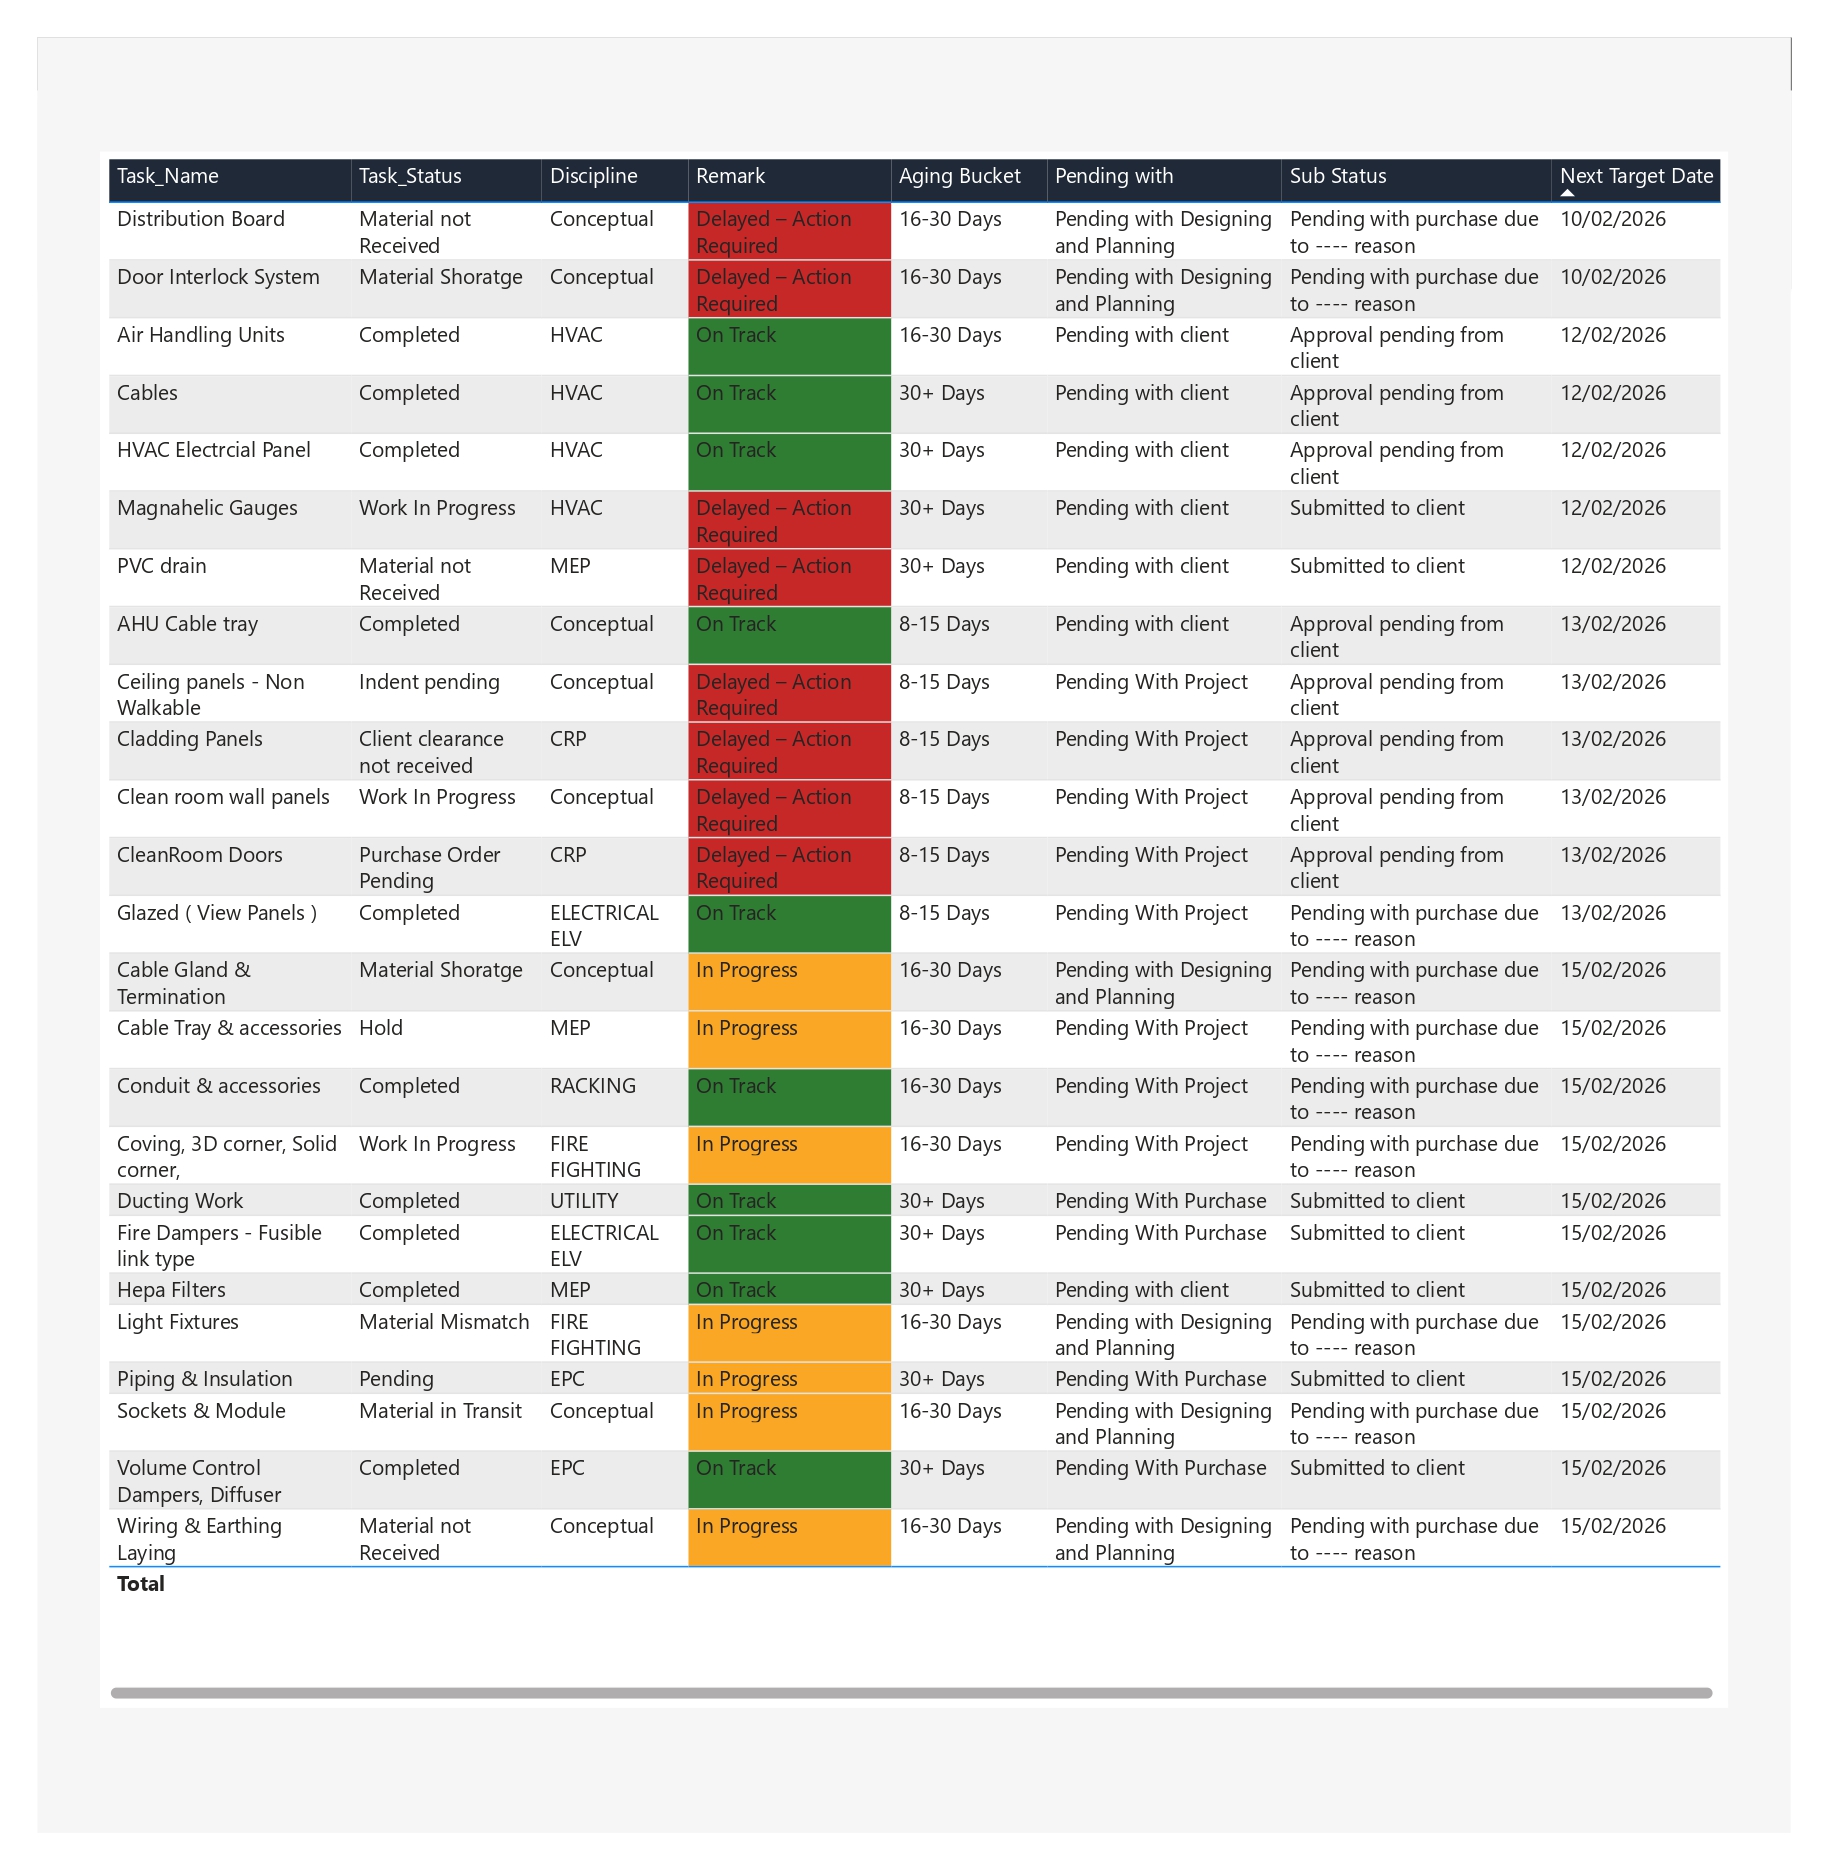
Dashboard Preview
Click on the dashboard preview images below to view them in full resolution. This Power BI dashboard includes execution monitoring, documentation tracking, aging analysis, and KPI-based project control insights.
Project Overview & Approach
This Power BI dashboard was developed to transform fragmented project data into a centralized execution monitoring system. The goal was to provide real-time visibility into task health, documentation progress, overdue tracking, and aging analysis.
Initially, data was stored separately in:
- Project Master
- TDS Register
- Documentation Register
- Project Execution Sheet
The datasets were cleaned, standardized, and structured into a relational data model. DAX measures were created for KPI calculations including On Track, In Progress, Delayed classification, and Aging Buckets (0-7, 8-15, 16-30, 30+ Days).
Tools & Technologies Used
AI-Assisted Development
AI-powered analytical assistance (ChatGPT) was used to refine dashboard structure, validate DAX logic, improve KPI hierarchy, and enhance visual storytelling.
Final data modeling, validation, and implementation were manually executed to ensure business accuracy and professional quality.