📊 Project Control & Execution Monitoring Dashboard

Power BI · Data Modeling · DAX · Business Intelligence

⬇ Download Dashboard PDF

🚧 Business Problem

  • Project data scattered across multiple Excel sheets
  • No visibility of delays and execution status
  • Manual tracking and reporting inefficiency
  • No centralized dashboard for decision-making

💡 Solution Approach

  • Centralized Power BI dashboard
  • DAX-based execution tracking logic
  • Aging analysis for delay tracking
  • KPI-based layout for quick insights

🧹 Data Preparation

  • Project Master
  • Project Execution
  • Documentation Register
  • TDS Register

📊 Key Dashboard Features

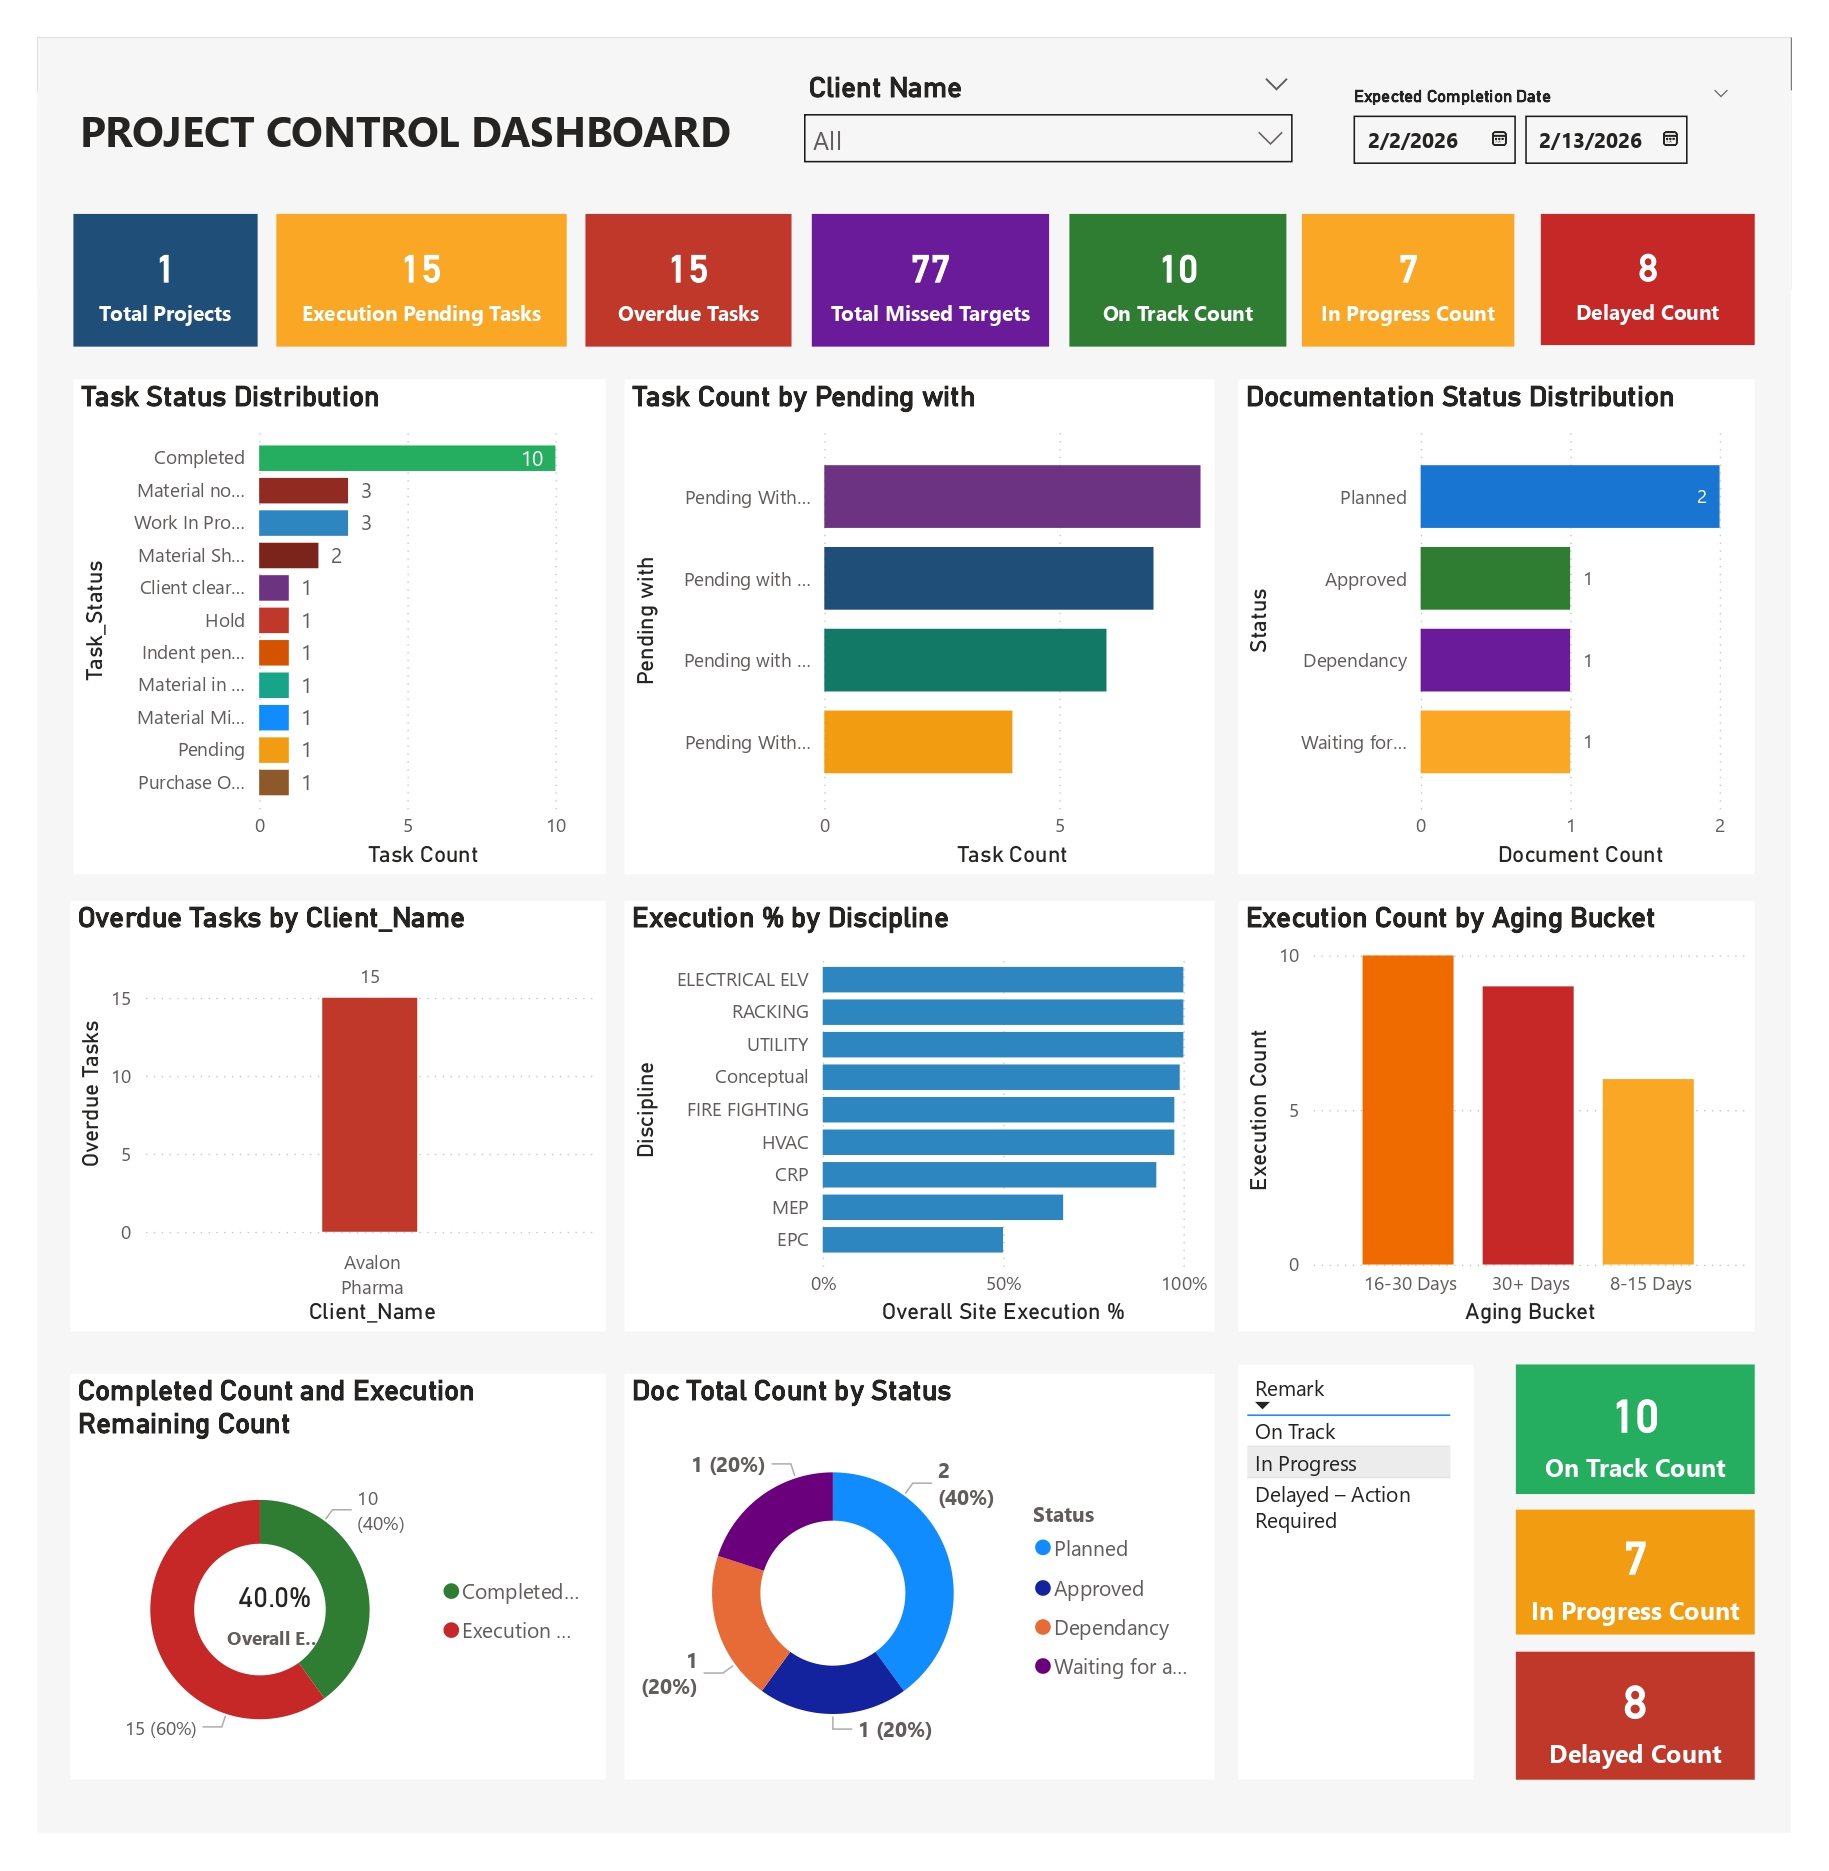
✔ KPI Cards (Projects, Tasks, Delays)
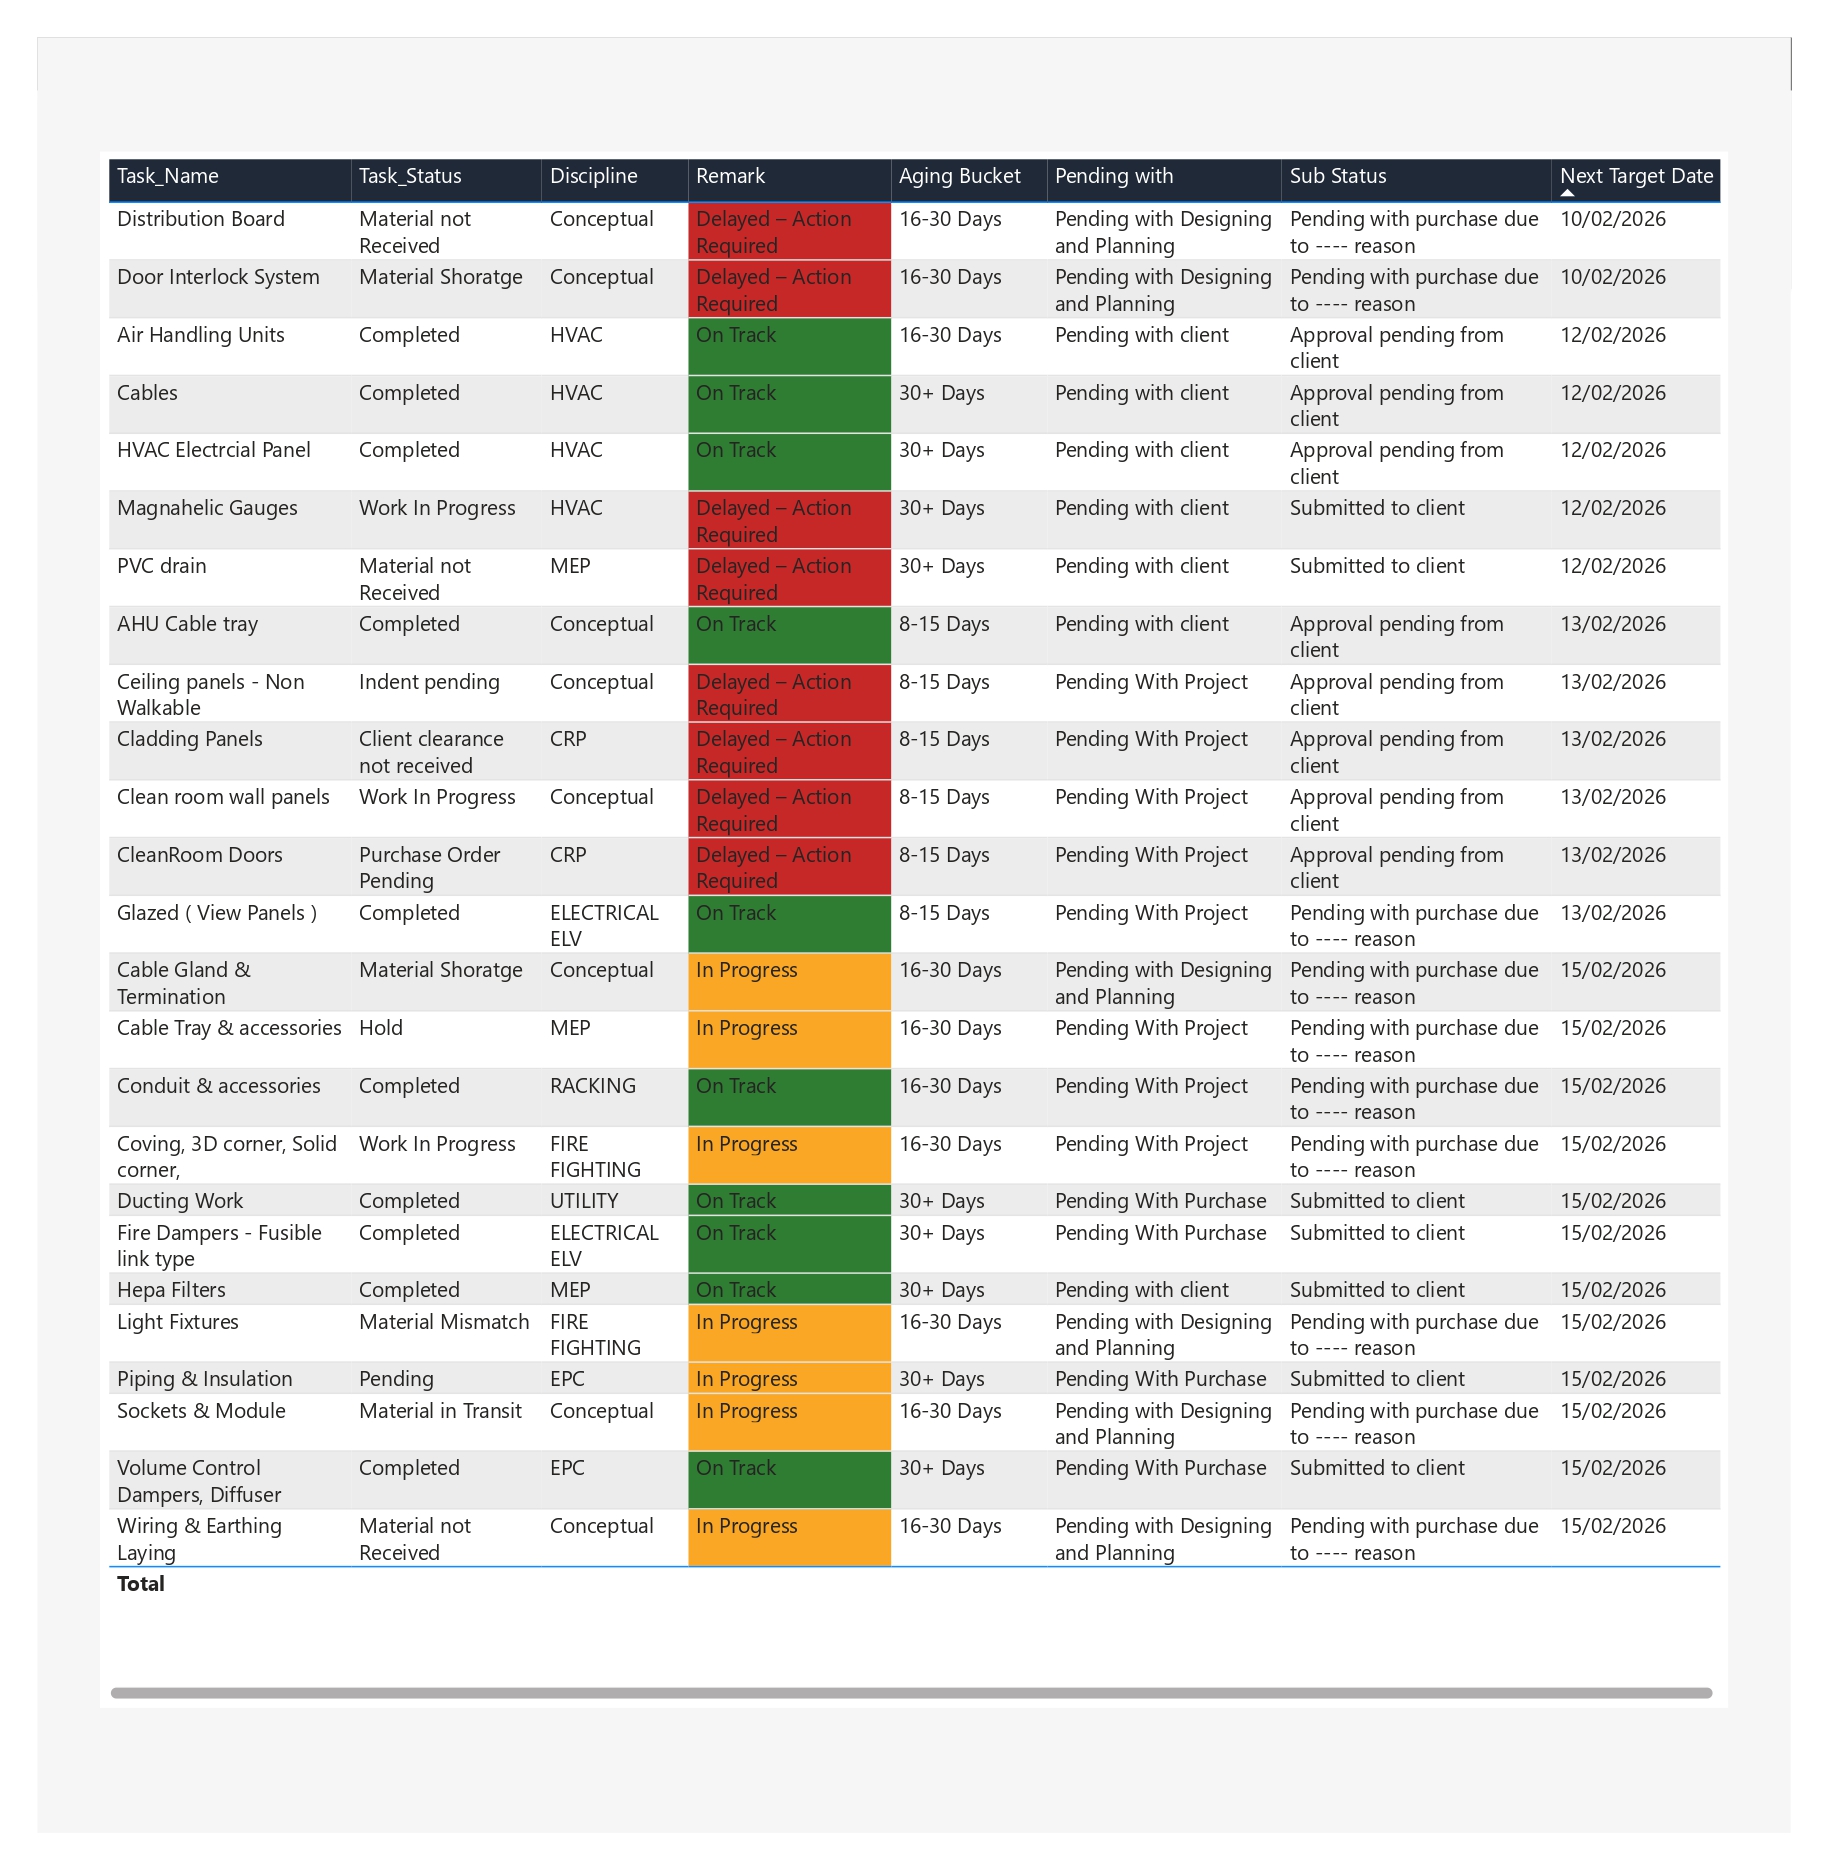
✔ Execution Status Tracking
✔ Project Completion Donut
✔ Aging Analysis
✔ Dependency Tracking

📈 Key Insights

  • Identified delayed and overdue tasks
  • Detected execution bottlenecks
  • Improved project visibility
  • Enabled faster decision-making

🧰 Tools & Technologies

Power BI DAX Excel Data Modeling Business Intelligence

🤖 AI-Assisted Development

This dashboard was developed with AI assistance to improve structure, DAX logic, and visualization design. Final implementation and business validation were handled manually.

📊 Project Control & Execution Monitoring Dashboard

Tools Used: Power BI · Excel · Data Modeling · DAX

This dashboard was designed to monitor project execution, identify delays, track documentation progress, and provide real-time visibility into operational performance.

🚧 Business Problem

  • Project data was scattered across multiple Excel sheets
  • No centralized visibility of task progress and delays
  • Difficult to track execution status (On Track / In Progress / Delayed)
  • Manual reporting caused delays in decision-making
  • No clear view of documentation status and pending dependencies

💡 Solution Approach

  • Built a centralized Power BI dashboard for project monitoring
  • Created structured data model from multiple Excel sources
  • Developed DAX logic for execution status (On Track / Delayed / In Progress)
  • Implemented aging analysis for execution tracking
  • Designed KPI-driven layout for quick decision-making

🧹 Data Preparation & Modeling

Raw data was initially unstructured and distributed across multiple sheets. To improve performance and usability, the data was cleaned and transformed into separate structured tables:

  • Project Master – Project-level information
  • Project Execution – Task tracking and execution details
  • Documentation Register – Document status tracking
  • TDS Register – Additional operational data

Relationships were created between tables to enable accurate reporting and filtering.

📊 Key Dashboard Features

  • ✔ KPI Cards for Total Projects, Pending Tasks, Overdue Tasks, and Missed Targets
  • ✔ Execution Status Tracking (On Track, In Progress, Delayed)
  • ✔ Project Completion Progress (Donut Visualization)
  • ✔ Task Status Distribution Analysis
  • ✔ Execution Analysis by Discipline
  • ✔ Aging Bucket Analysis (0-7, 8-15, 16-30, 30+ Days)
  • ✔ Dependency Tracking (Pending with Client, Purchase, Design)
  • ✔ Interactive Filters (Client Name, Date Range)

📈 Key Insights Generated

  • Identified high number of overdue and delayed tasks
  • Highlighted departments with lower execution performance
  • Detected bottlenecks in approval and dependency stages
  • Improved visibility of project completion status

🤖 AI-Assisted Development

This dashboard was developed with the assistance of AI tools to:

  • Design the dashboard layout and structure
  • Optimize DAX calculations and logic
  • Improve data modeling approach
  • Enhance visual storytelling and user experience

Final implementation, validation, and business logic were manually handled to ensure accuracy.

📥 Dashboard Preview

Click below to view the full dashboard report:

Download Full Dashboard (PDF)

🧰 Tools & Technologies

  • Power BI
  • DAX
  • Excel
  • Data Modeling
  • Business Intelligence

This project demonstrates my ability to transform raw data into actionable business insights using Power BI.